I am hosting theobjectivedad.com from my homelab out of my residential Internet service. Although service disruptions of a self-hosted personal website won’t cost me my career I still want to make theobjectivedad.com as available as possible. This means adding an entire universe of scope that, for the most part, begins with implementing a health check and will likely end with multi-site hot-hot availability.
In this article, I will explore how I implemented health checks and monitoring on theobjectivedad.com. I cover the overall monitoring architecture, how I developed the readiness and liveliness endpoints, and how I configured internal and external monitoring.
Architecture
As shown in the diagram below, each of the 3 Nginx pod replicas hosts a copy of the website and provides two health-related endpoints. The first, https://www.theobjectivedad.com/sys/alive responds with an HTTP 200 when Nginx is running and can respond to requests. The second, https://www.theobjectivedad.com/sys/ready, responds with an HTTP 200 when the pod can serve the actual site.
flowchart LR
subgraph Cloudflare
direction TB
TUNNEL(fab:fa-cloudflare Tunnel)
end
subgraph K8sLab
direction TB

subgraph Deployment
direction LR

NGINX1("<Pod>\nfas:fa-server Nginx")
NGINX2("<Pod>\nfas:fa-server Nginx")
NGINX3("<Pod>\nfas:fa-server Nginx")

READY1("fas:fa-file /sys/ready")
ALIVE1("fas:fa-file /sys/alive")

READY2("fas:fa-file /sys/ready")
ALIVE2("fas:fa-file /sys/alive")

READY3("fas:fa-file /sys/ready")
ALIVE3("fas:fa-file /sys/alive")

NGINX1 -.- ALIVE1
NGINX1 -.- READY1

NGINX2 -.- ALIVE2
NGINX2 -.- READY2

NGINX3 -.- ALIVE3
NGINX3 -.- READY3

end

CONNECTOR("<Deployment>\nCloudflare Tunnel")
INGRESS("<Ingress>\nIngress Controller")
SERVICE("<Service>\nService")


TUNNEL -- "HTTP2" --> CONNECTOR
CONNECTOR -- "HTTP2" --> INGRESS
INGRESS -- "HTTP2" --> SERVICE
SERVICE -- "HTTP" --> Deployment

KUBLET("fas:fa-gear Kublet")
KUBLET ---> NGINX1
KUBLET ---> NGINX2
KUBLET ---> NGINX3

end

ROBOT("<SaaS>\nfas:fa-robot Uptime Robot")
ROBOT -- "HTTPS" --> TUNNEL
Whenever a pod replica starts in the Nginx Kubernetes deployment, a sidecar process synchronizes the published content from a git repository to an emptyDir in the pod. It is important to differentiate between the pod being dead (needs a restart) vs not being ready to serve content (the sync process is running). If I only implemented a single health endpoint for both liveliness and readiness checks I would run the risk of infinite restarts if the synchronization process ran longer than the liveliness threshold.
Internally, the Kubernetes Kublet is configured to periodically check both /sys/alive and /sys/ready for each replica. After a given number of failures on /sys/alive the Kublet will attempt to restart the pod.
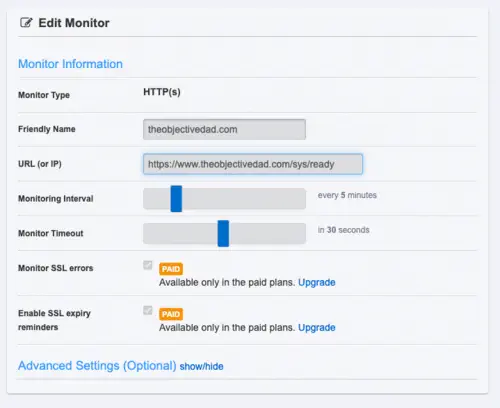
Externally, I am using UptimeRobot, a freemium service that periodically hits my /sys/ready endpoint to verify the site is still running.
Endpoint Setup
The entire health check project started by implementing the actual endpoints /sys/alive and /sys/ready endpoints.
The process that renders the actual site content uses Pelican which will build a static copy of the entire site based on my pre-configured theme and pre-written content. Pelican allows for the use of Jinja templates, which will come in handy when building out readiness endpoint.
Since I want the readiness check to fail if the git sync process fails, the readiness endpoint must be deployed during the git sync process. This has the side benefit of allowing me to include additional information in /sys/ready to be rendered by Pelican:
{
    "status": "OK",
    "site": {
        "url": "{{SITEURL}}",
        "rendered": "{{last_updated}}",
        "production": {%if PELICAN_PROD%}true{%else%}false{%endif +%}
    }
}
After Pelican renders the page the final output will look something like this:
{
    "status": "OK",
    "site": {
        "url": "https://www.theobjectivedad.com",
        "rendered": "2023-03-01T13:11:44Z",
        "production": true
    }
}
To configure /sys/ready to point to the rendered readiness page, I needed to make a few configuration changes to nginx.conf:
location = /sys/ready {
    # Serve rendered health information from file
    try_files /ready.json =404;
    add_header Content-Type "application/json";

    # Advise clients to never cache
    add_header Cache-Control "no-cache, no-store, must-revalidate";
    add_header Pragma "no-cache";
    expires 0;

    # Disable logging
    log_not_found off;
    access_log off;

}
The previous configuration binds the /sys/ready location to the ready.json file rendered by Pelican and deployed by the synchronization process or returns an HTTP404 status if ready.json is not found. Additionally, I am adding several response headers to signal to clients to not cache old copies of the response which would defeat the purpose of the health check endpoint. Finally, as a matter of personal preference, I disable logging to the health check endpoint.
Next, I needed to add another location to nginx.conf to enable the /sys/alive endpoint. While it is similar to the previous block the important difference is that it isn’t looking for an external page and instead uses the return directive to respond with a simple JSON payload. This is sufficient to verify that Nginx has started and is capable of responding to requests.
location = /sys/alive {
    # If the server is up, return a simple JSON response and HTTP 200
    return 200 "{\"status\": \"OK\"}";
    add_header Content-Type "application/json";

    # Disable logging
    log_not_found off;
    access_log off;

    # Advise clients to never cache
    add_header Cache-Control "no-cache, no-store, must-revalidate";
    add_header Pragma "no-cache";
    expires 0;
}
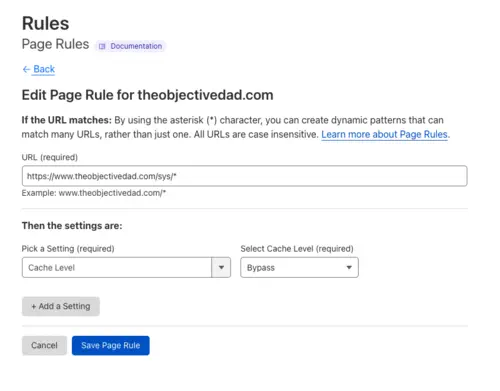
The final step was to add a page rule to the Cloudflare configuration to ensure the health check page is never cached. This is important for both automated external monitoring and anyone else who wants to see a real (not cached) status page via the browser:

Internal Monitoring
Implementing Kubernetes health check probes could be an entire article in itself and requires some knowledge about how a pod behaves as well as how Kubernetes handles liveliness and readiness failures. To keep things simple let’s take a look at the important minimum / maximum times I’m anticipating for the pods hosting this site in the table below.
| Condition | Probe | Formula |
|---|---|---|
| Pre startup, minimum time before pod is ready | startupProbe |
\(\text{initialDelaySeconds}\) |
| Pre startup, time before pod is restarted due to not ready | startupProbe |
\(\text{initialDelaySeconds} + (\text{periodSeconds} \times \text{failureThreshold})\) |
| Post startup, minimum time before the pod is restarted due to liveliness failure | livenessProbe |
\(\text{periodSeconds} \times \text{failureThreshold}\) |
| Post startup, minimum time before traffic is redirected away from the pod | readinessProbe |
\(\text{periodSeconds} \times \text{failureThreshold}\) |
Again, there are more considerations here than I mentioned but this does represent the major points. To implement the internal probes I added the following configuration to the deployment manifest:
Startup probe:
startupProbe:
    httpGet:
        path: /sys/ready
        port: 8080
    periodSeconds: 5
    failureThreshold: 100
    successThreshold: 1
Liveliness probe:
livenessProbe:
    httpGet:
        path: /sys/alive
        port: 8080
    periodSeconds: 5
    failureThreshold: 3
    successThreshold: 1
Readiness probe:
readinessProbe:
    httpGet:
        path: /sys/ready
        port: 8080
    periodSeconds: 5
    failureThreshold: 3
    successThreshold: 1
External Monitoring
With the health check endpoint in place, I was ready to add external monitoring. This isn’t a space I have much expertise in however a quick Google search for “free website monitoring” led me to UptimeRobot which seemed good enough.
While the free tier has some restrictions such as a minimum check interval of 5 minutes is adequate for a self-hosted personal website. The setup was simple enough and even offers a publicly facing dashboard:

Although not everyone would care about it, having a decent mobile app was certainly nice. Best yet, it is available in the free tier:

Final Thoughts
This is a fairly good start and adds a useful capability to my toolbox. I can’t understate this enough because the next time I need to design or implement a health check endpoint or monitoring service I’ll have a working model to start with.
While going through this exercise I did identify a few additional enhancements that I would like to have but didn’t have time to implement including:
- Add
jqto the Nginx container so the Kublet can run assertions on the JSON responses coming back vs looking at the status code. - Add a sidecar that will periodically update
ready.jsonwith additional information such as an instance identifier (which can be helpful for troubleshooting)
The next milestone in the monitoring and availability space for me will be to create a secondary “data center” that I can host this site from. Being a statically-generated site it shouldn’t be that difficult but will require some additional changes to my CI/CD process. I also don’t want to get hooked into any monthly costs which means I’ll need to set up a workflow start and stop infrastructure as well as explore routing options available in the Cloudflare free tier.